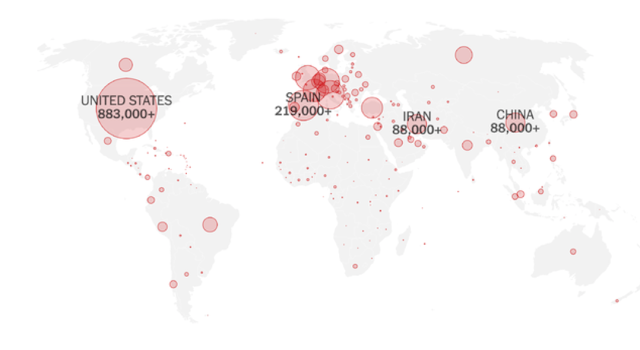
The map and table below show that the United States is by far the most affected based on confirmed/reported cases of Covid-19. The first is from the New York Times, April 24.
The second is from Johns Hopkins University's website.
 |
| Worldwide, Confirmed and Reported Cases, Johns Hopkins University Map, April 24, 2020. |
1. 869,170 United States
2. 213,024 Spain
3. 189,973 Italy
4. 159,460 France
5. 153,129 Germany
6. 139,246 United Kingdom
United States
The map and table below show that New York State and New Jersey have been taking the brunt of the impact of the virus, with nearly 21,000 deaths in New York.
 |
| USA Confirmed Cases, Johns Hopkins University Map, April 24, 2020. |
New York State
This map and table shows that within New York State, the incidence of cases by county is highest in New York City and surrounding counties, where the density is highest. Nassau and Suffolk both have about 30,000 reported cases of the coronavirus, both about 2,000 cases per 100,000 population (2 percent), but Nassau has many more deaths relative to the number of cases.
New York City and Top Five Counties by Reported Cases and Deaths (New York Times)
Suffolk County (NYS Department of Health), Towns
The map and table below show that the high concentration of Covid-19 cases are on the western end of the county, where the density is higher. The Town of Islip has the highest count of cases.
Source: Bonac TRS, April 23, 2020
East Hampton Town
This table shows that East Hampton Town has been spared so far any deaths but the Village has a high number of cases relative to the residential population. This reflects the fact that the Village is a commercial center with continuig interaction.
East Hampton Town, Census Places (Hamlets and Villages)
Compared with Global, U.S., NYS, NYC, Nassau County and Suffolk County
Source: Data from previously cited sources. Computations by CityEconomist.


No comments:
Post a Comment