Showing posts with label New York City. Show all posts

Friday, June 5, 2020

UNEMPLOYMENT | Local Rates Higher

June 5, 2020—New Yorkers have a feel for these things and they are surprised at a reported U.S. unemployment rate of 13.3 percent. Economic analysts surveyed by Dow Jones expected nonfarm payrolls to decrease by 8.3 million while their average estimate of the May unemployment rate was 20.5 percent.

The BLS actually reported this morning a 2.5 million increase in payrolls, the largest increase on record.

One explanation is that in New York City the unemployment rate might be much higher. Using a simple forecasting model based on April and prior months, the New York City unemployment rate for May would be above 20 percent, i.e., 21.6 percent.

Here are the May numbers for New York City and neighboring counties, as projected from prior months. All of these actual BLS numbers for May will not appear until close to the date when the national unemployment rate for June is released.

Unemployment Rates - U.S. and Local, May 2020

U.S. Rate, %
Projected Local Rate, %
New York City
13.7
21.6
Nassau Co.
13.7
15.1
Suffolk Co.
13.7
15.7
Westchester Co.
13.7
14.1
Source: May unemployment rate from BLS. Projected
May local rates by CityEconomist.

For the future, New York City may outperform the rest of the country because it has been through the coronavirus mill earlier. It has just had its first day since March 12 without a confirmed coronavirus death.

(Hat tip to Dr. Jurgen Brauer, Geoffrey Hilton and Dr. Farid Heydarpour for assistance with the interpretation of the data.)

Sunday, April 26, 2020

CITYECONOMIST VIEWS | 465K. Top Ten Posts.

This CityEconomist blog has passed 465,000 page views.

Thank you for reading!

Here are the top ten most-read CityEconomist posts during April.

Entry
IRELAND | USA More to Be Pitied than Scorned
Apr 27, 2020
COVID-19 STATUS | U.S. Summary in One Table
Apr 5, 2020, 1 comment
GERMAN ELECTIONS, 1933 | How a Democracy Was Destr...
Mar 5, 2017
WW2 | 9. Resistance Banker–Wally van Hall
Feb 19, 2015
TRUMP'S TRADE WAR | How the Détente Magnified the ...
Apr 27, 2020
MEDICAL SUPPLIES | Maloney, Axne Call for Lifting ...
Apr 2, 2020
METRO DEATHS | NY area likely to pass 10,000 death...
Apr 3, 2020
OVERSEEING $2.2 TRILLION | Donna Shalala
Apr 19, 2020
PANDEMIC | Global to Local Data
Apr 23, 2020
BIRTH | Marjory Stoneman Douglas, 1890
Apr 7, 2020

Please comment below any post, or send a note to your blogger at john[at]CityEconomist.com.

Thursday, April 23, 2020

PANDEMIC | Global to Local Data

Global

The map and table below show that the United States is by far the most affected based on confirmed/reported cases of Covid-19.  The first is from the New York Times, April 24.
The second is from Johns Hopkins University's website.
Worldwide, Confirmed and Reported Cases, Johns Hopkins University Map, April 24, 2020.
Total cases confirmed worldwide as of Friday morning, April 24: 2.7 million. The most confirmed/reported cases now are in these five countries:
1. 869,170 United States
2. 213,024 Spain
3. 189,973 Italy
4. 159,460 France
5. 153,129 Germany
6. 139,246 United Kingdom

United States

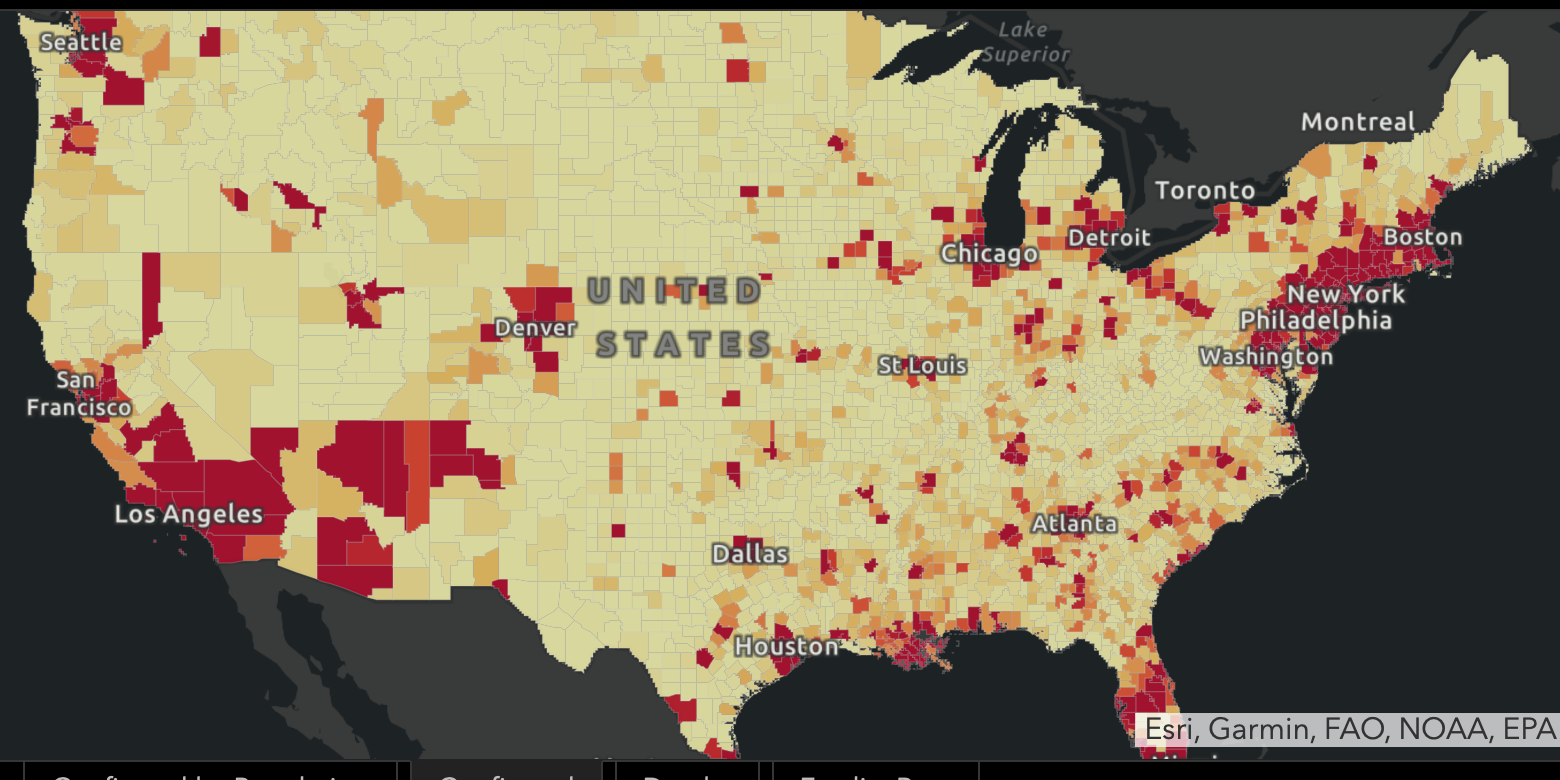
The map and table below show that New York State and New Jersey have been taking the brunt of the impact of the virus, with nearly 21,000 deaths in New York.


USA Confirmed Cases, Johns Hopkins University Map, April 24, 2020.
Top ten states by confirmed cases (from the The Guardian, April 24, 2020)

New York State


This map and table shows that within New York State, the incidence of cases by county is highest in New York City and surrounding counties, where the density is highest. Nassau and Suffolk both have about 30,000 reported cases of the coronavirus, both about 2,000 cases per 100,000 population (2 percent), but Nassau has many more deaths relative to the number of cases.


New York City and Top Five Counties by Reported Cases and Deaths (New York Times)


Suffolk County (NYS Department of Health), Towns


The map and table below show that the high concentration of Covid-19 cases are on the western end of the county, where the density is higher. The Town of Islip has the highest count of cases.


Source: Bonac TRS, April 23, 2020

East Hampton Town

This table shows that East Hampton Town has been spared so far any deaths but the Village has a high number of cases relative to the residential population. This reflects the fact that the Village is a commercial center with continuig interaction.

East Hampton Town, Census Places (Hamlets and Villages)
Compared with Global, U.S., NYS, NYC, Nassau County and Suffolk County
Source: Data from previously cited sources. Computations by CityEconomist.

Friday, April 3, 2020

NY STATE | County Deaths from COVID (2)

April 3, 2020—In one week, the death rate from COVID-19 per 100,000 population tripled in New York City. It was between 5.5 and 5.8 deaths per 100,000 population in the Bronx, Staten Island (Richmond County) and Queens, and was 3.2 to 3.5 in Brooklyn and Manhattan. See prior post, one week ago.

Rockland again had the highest death rate outside of New York City, rising from 1.6 to 13.5, a huge increase of nearly tenfold. Nassau, which had been behind Suffolk last week, rose from 0.7 deaths per 100,000 to 10.3, an increase of nearly 15-fold. Suffolk's death rate rose five-fold. Westchester's death rate rose from 0.1 per 100,000 to 7.1, a 71-fold increase...
Sources: New York Times Interactive for population data except NYS and NYC, Cases per 100,000 pop. and Deaths. NY State Population from World Population Review as of 2020-02-17, retrieved 2020-04-03.  NY City population as of 2019, Census estimate. Death rates computed by JTM.
The Centers for Disease Control and Prevention (CDC) has found the same pattern emerging in the United States as has prevailed in other countries in Asia and Europe, namely the hardest hit are the older age groups.

Especially vulnerable are those 85 and older, for whom the death rate is more than 10 percent of the number of confirmed cases.

This is why so many cases and deaths are being found in nursing homes.

METRO DEATHS | NY area likely to pass 10,000 deaths

Italy's lockdown.
April 3, 2020—On a Zoom chat this morning, someone asked about the future for the U.S. and New York City economy. I suggested that  it depends on how we manage the pandemic at the NY City, State and Federal level.

The number to watch, I said, is the death rate, because by now everyone is aware that the "confirmed cases" number is dependent on how many tests are done. Shortages of testing kits reduce the number of confirmed cases but also, by delaying proper care and isolation, contribute to higher death rates. The number of cases is not a good measure of the outcome of the disease.

Chart 1. Virus Cases by Country, David
Leonhardt, NY Times, March 31, 2020.
Whichever measure we use, the  prognosis for the United States is for the disease to worsen before it gets better.

Let's look first at the number of cases. Did the United States get ahead of the curve between the time that the disease started in China and then spread to Italy? The chart at right, by David Leonhardt in the NY Times on March 31, suggests not.

In fact, by this point in the progress of the virus, China and Italy and even Spain were both doing better based on cases. But this chart is subject to testing bias. If the United States is "not flattening," the reason may simply be that the United States has stepped up the rate of testing.

Deaths in a democratic country are hard to fake or hide. People are paid to track them. A death from the coronavirus follows a gruesome pattern that should now be not hard to diagnose. Population numbers are closely watched. So, horrible though they are, the death rates are "good"  measures of the spread of COVID-19.

Table 2. Top lines, NY Times Upshot 
table, March 27, 2020.
The table at right shows the top seven lines of a table published as an Upshot in the New York Times. As the accompanying text in the story points out, the death rates lag cases, so they are not the best measure of the challenges being faced at the moment in the hospitals.

Because China was ahead of Europe, and Europe has been ahead of the United States, in facing the coronavirus, the Lombardy and Wuhan death rates are worth looking at as a guide to what might happen in the New York City area.

If there is a bias in the death rates in Lombardy and Wuhan, it is probably on the low side:
  • Yes, Italy has an unusually elderly population, second in the world after Japan. This would tend to raise the death rates relative to New York — the median age in Lombardy is about 45, whereas it is 38 in New York. But Lombardy numbers may be considerably understated because many deaths that did not occur in hospitals were not counted by the health care reporting system — i.e., they might not have been counted if they occurred where people live, even if they were in nursing homes. 
  • The Wuhan numbers may also be undercounted. A classified U.S. report suggests that C.I.A. insiders believe that Chinese cases and deaths from the virus may have been systematically underreported.
What do the death-rate numbers tell us? It is not in the Upshot story, but if the progress of the disease in the New York area matches that of Lombardy, we can expect a death rate of approximately 0.5 per thousand applied to a New York City metro area population of 20 million, or 10,000 deaths.

Chart 2. New York deaths higher than
Lombardy at same point. Upshot,
NY Times, April 3, 2020.
The math is not hard to follow. Lombardy suffered 5,000 deaths, in round numbers. It has half the 20 million population of the New York City Metro Statistical Area.* So one would expect, all else equal, that the New York metro area would end up with double the Lombardy deaths, or 10,000.

Today, April 3, the New York Times published another Upshot chart showing how we are doing on death rates relative to the Lombardy region. It should not make us complacent.

Upshot shows on the chart that the NY City death rate until the last observation has been doubling every two and a half days. It has been on a trajectory well above Lombardy's for a week, until the latest day. Governor Cuomo has noted in his 11 a.m. daily updates a marked improvement in the State trajectory in the last few days. If he is right, it is a breakthrough and he should get credit for it. The Governor's recent moves have improved the odds that the State's hospital system will be able to handle the coming peak load of patients. Meanwhile, we should watch the numbers carefully. It still seems likely that the New York metro area will exceed Lombardy's death rate.

* The NY metro is the statistical area (MSA), not the Combined Statistical Area (CSA), which would add another 3 million people. The NY MSA is composed of four Metropolitan Divisions; one of them is Nassau-Suffolk, two counties that together constitute Long Island as a Metropolitan Division.

Wednesday, July 25, 2018

UBER, LYFT | Adding to Congestion (Update Nov. 2, 2018)

In 2015 and 2017, I posted on the fact that traffic congestion on New York City streets seemed to me to be rising pari passu with  the growth of the online ride-hail services like Uber and Lyft.
A new report confirms this hunch:
  • About 60 percent of ride-hail company users “in large, dense cities would have taken public transportation, walked, biked or not made the trip” if those services had not been available.
  • The other 40 percent of users would have taken their own car or a taxi.
  • As a result of rides replacing mass-transit trips, the ride-hall services put 2.8 new vehicle-miles on the road for each mile of personal driving they take away. 
  • It amounts to a 180 percent increase in driving on city streets.
The report was prepared by transportation consultant Bruce Schaller. Read more in The New Automobility: Lyft, Uber and the Future of American Cities.
My point was not that the ride-hail services should necessarily be restricted, but that we can expect more congestion as they grow and we need to prepare.

We need a decongestant stronger than Vicks.

UPDATE, November 2, 2018
Uber and Lyft present themselves as replacing private cars. But in fact accumulating evidence suggests that they are positioning themselves as an alternative to public transit and are making congestion worse. Read this:
https://www.huffingtonpost.com/entry/uber-and-lyft-say-theyre-solving-traffic-while-making-it-worse_us_5bdb3662e4b0da7bfc181c32

Wednesday, July 11, 2018

POLICE | Rate of Fatal Shootings, Large U.S. Cities

Source: Excerpted from https://priceonomics.com

July 11, 2018 – There's a company called Priceonomics that works with organizations that collect data to analyze the information.

Their latest release is a table showing the rate of fatal shootings relative to the population of major cities in the United States, during the years 2000 and 2018.*

New York City has the lowest rate, 0.2 deaths per 100,000 population. St Louis has the highest rate, 36.3 deaths per 100,000 population.

The St Louis rate is 181 times bigger.

A big hand for the NYPD, and for former Police Commissioner Bill Bratton, who managed the changes in the Department that led to the low NYC death rate, along with the gun control laws.

And congratulations to the various groups along the way that have helped in the effort to improve gun safety, such as Everytown for Gun Safety, the largest gun violence prevention organization in the United States. John Feinblatt, the organization's president, was part of former New York City Mayor Michael Bloomberg's administration, serving as NYC's criminal justice coordinator. In 2010 Feinblatt was appointed the Mayor’s chief policy advisor. Previously he was founding director of the Center for Court Innovation and the founding director of Midtown Community Court.**

*https://priceonomics.com/the-places-with-the-most-and-least-police/.
**https://www.guns.com/2014/07/01/exclusive-interview-with-everytown-president-gun-control-discusses-its-agenda/


Monday, January 29, 2018

COMPTROLLER'S OFFICE | 3rd FOCEA VB Reunion, 2018

FOCEA meets again at Citron Bistro, Vero Beach, Florida. L to R: Eric Wollman,
John Tepper Marlin. Photo by Alice Tepper Marlin.
January 28, 2018 – On this date, Eric Wollman, the founder of FOCEA, the Former Office of the [New York City] Comptroller Employees Association, paid his annual visit to Vero Beach, Florida. This is our 3rd annual reunion.

Last year we had with us former 1st Deputy Comptroller Steve Newman (http://bit.ly/2EkNo01). This year it was back to the two of us.

Eric and I had lunch with Alice Tepper Marlin at Citron Bistro on the Barrier Island of Vero Beach, off A1A near the Indian River Shores Village Hall.

Eric attends the annual Uniformed Services Patch Collectors' meeting in Titusville, Florida, and then drives down to visit on his way to relatives farther south. I asked him whether FOCEA would continue to exist now that he himself is retired and was heart-broken to discover that in his own retirement Eric is losing touch with retirees.

Can anything be done?  Meanwhile, I will continue to post on informal FOCEA get-togethers, such as the one with my successor as Chief Economist, Frank Braconi, last year (http://bit.ly/2Gv2hhi).

Here is a story from Eric Wollman about the retirement this month of Yvette Hibbert, whom I knew well at the Comptroller's Office:


Friday, December 29, 2017

VIEWS | 390K. Ten Most-Viewed Posts in December. Thank You for Reading.

Guadalajara, December 30, 2017 – Thank you for reading this blog.

We just passed the 390,000-view mark. Next stop: 400,000.

Please let us all have the benefit of your thinking by commenting on any of these posts or contact us at info@cityeconomist.com or john@boissevainbooks.com.

To subscribe to this blog, or its comments, or to search its contents or to forward it using G+, see the options at top right.

Thursday, December 28, 2017

TECH WARS | Have You Noticed? Taxis+Uber+Lyft=More Congestion!

Midtown Manhattan traffic averages 4.7 mph,
down from 6.5 mph five years ago. 
Back in 2015, on this blog site, I said that Uber's putting more cars on the road  seemed to be creating more congestion in New York City

My friend and co-thinker David Hochman instantly chimed in to say that he had the same perception.


We got some pushback on this idea. We decided to wait for data.

If you saw the same thing, guess what? We were all seeing straight. A few weeks ago, a study concluded that Uber and Lyft are indeed creating more congestion, more trips, more miles

Objectively, midtown traffic speed is measured at an average of 4.7 miles per hour, down from 6.5 miles per hour five years ago. Support has grown for rules or charges to discourage cars from coming into the most congested parts of New York City. One approach is a Pigou Tax such as has been introduced for sugary soda and cigarettes.


Sure, part of the congestion problem has been growth of the New York economy. But consider that this effect has been offset by the decline of brick-and-mortar retail stores. These stores have lost out to Amazon and other on-line vendors. Consider also this:
  • The lobby of my building in Chelsea is right now being torn apart to make room for packages. Residents are having to walk through the basement entrance.
  • Why? Because when the building was erected in the 1960s there was no space allocated for packages and the cabinet space that was added a decade later wasn't sufficient. 
  • Now the storage space is being expanded ten-fold.
  • Some buildings in Manhattan just a few years old are already overwhelmed with the packages.
These package deliveries require more trucks and they are one source of greater traffic. But the biggest culprit may simply be the number of vehicles on NYC streets that are available for hire:
  • The number is now up to 103,000, double the 47,000 figure for 2013, says the Taxi and Limousine Commission. 
  • Of these vehicles, 68,000 are affiliated with ride-hailing app companies, including 65,000 with Uber alone. 
  • Yellow taxis are capped by city law at just under 13,600, with the idea of limiting congestion. The City's intent has been circumvented. (Full disclosure: I've served as an expert witness for an association of taxi-medallion owners and an association of Airbnb owners.)
New York City now has many more police on traffic duty and is taking another look at congestion-pricing plans that were advocated by Mayor Michael Bloomberg. A plan of this type is being used successfully in London. (A similar plan for Paris met with more opposition.)

New York City seems to be facing a conflict between new technology attractive to many consumers, and the people whose livelihoods and assets are being disrupted:
  • taxi owners, 
  • drivers, 
  • other drivers facing longer delays, and 
  • businesses affected by the congestion of heavily trafficked streets. 
The same disruptions are taking place for retail stores, housing renters and others disrupted by the wonders of new technology. The inconveniences have knock-on effects for owners of commercial and residential property.

This conflict is not new. If you come back to this blogsite in the next few weeks, you will find more posts under this hashtag (#TechWars). You will see how the conflicts have played out in many industries where technology has changed. This may serve as a guide to what we may expect during the coming years. The general theme is that the introduction of new technology requires a period during which the technology is tested and during which natural enemies emerge.

For example, using engines on ships was fought by sailors. Railways and cars and tractors were resisted by breeders and outfitters of horses. Photography was resisted by artists. These days, Uber is fought by cities and taxi owners, and by competitors. Yet Uber has a database that could be enormously helpful in planning for new transportation initiatives.

Invention is only half the battle. Getting the technology accepted where it replaces existing industries is the other half. Marconi spent his life battling the wired-telegraph companies, and the telegraph companies were largely successful in slowing down the introduction of wireless telegraphy. Where Marconi's invention succeeded was in a whole new area that he had not foreseen, namely broadcasting.

The period during which new technologies are tested against old ones can be called one of symbiosis. Sometimes the new technology never completely replaces the old one. Gas never completely replaced wood and coal as fuel. Electricity never completely replaced gas. You may be interested in some of the implications of all this... Stay tuned.

Postscript 1 (January 2, 2018): The Wall Street Journal predicts that a plan for congestion charges will be included in Gov. Andrew Cuomo's State of the State speech.

Postscript 2 (January 14, 2018) The New York Times reviews the growing number of private transportation options for commuters.

To subscribe to this blog, or its comments, or to search its contents or to forward this post using G+, see the options at top right.

Saturday, December 2, 2017

NEW YORK CITY | What Kind of Workplaces Treat You Best?

Happy Workers. How Happy Are You?
Crain's New York has issued another annual ranking of the "Best Places to Work". It may be found here: http://bit.ly/2AChpJx.

I have sorted the companies by type of business. This shows clearly how much the list is weighted toward advertising, finance, law, marketing, real estate, technology – and their tech-age specialties. I have slightly changed some of the descriptions of the type of business to group together similar companies.

These sectors pay well. They are also sectors that would interact frequently with Crain's. Many of the categories are traditional strongholds of New York City. Others wouldn't have existed 20 years ago, even ten years ago...

The growth in software as a driving force for jobs, identified in the 1999 New York City Comptroller's report on software and IT, is still with us.

Rank Type of Business Name of Company
71 Accounting WithumSmith&Brown
92 Accounting Anchin
61 Advertising Noble People
83 Advertising – Native TripleLift
8 Advertising – Native, software Sharethrough
19 Advertising analytics for travel brands Intent Media
43 Advertising software The Trade Desk
88 Advertising technology YellowHammer Media Group
93 Advertising technology Index Exchange
94 Advertising technology PulsePoint
52 Advertising/public relations/marketing Capacity Interactive
56 Advertising/public relations/marketing Teads
2 Application integration Button
33 Asset management Star Mountain Capital
86 Asset management GPB Capital Holdings
28 Business consulting – tech West Monroe Partners
60 Business consulting – tech hiring Vettery
66 Business consulting and software CoEnterprise
17 Cloud computing Salesforce
75 Co-ed sports leagues ZogSports
14 Community of online programmers Stack Overflow
57 Construction Gilbane Building Co.
58 Construction Rusk Renovations
36 Construction management T.G. Nickel & Associates
44 Construction management Clune Construction Co.
59 Content marketing Conductor
72 Contract furniture Meadows Office Interiors
39 Database software MongoDB
30 Digital – advertising Good Apple Digital
77 Digital – advertising Ready Set Rocket
63 Digital – advertising, predictive AdTheorent
45 Digital – interactive content Arkadium
4 Digital – marketing Path Interactive
6 Digital – marketing Elite SEM
7 Digital media solutions Digital Remedy
76 Digital payment services Payoneer
80 Digital promotions RevTrax
68 E-commerce – direct-to-consumer Spring
47 E-commerce for health products FSAstore.com,
HSAstore.com
64 E-commerce fraud-prevention Riskified
98 Engineering and architecture RAND Engineering & Architecture
96 Event marketing software Splash
41 Event ticket marketplace SeatGeek
18 Events FIRST
22 Financial – ETFs WisdomTree
89 Financial – news, education Investopedia
49 Financial – services Fortis Lux Financial
73 Financial – small-business loans Fundera
99 Financial – stock exchange IEX
48 Financial – tech Liquidnet Holdings
91 Financial – trading algorithms Pragma Securities
12 Global campaigns DoSomething.org
32 Health care marketing Evoke Health
34 Health care software CipherHealth
29 Human-resources outsourcing Insperity
65 Information technology Myriad Supply
90 Insurance – life Theodore Pappas & Associates
38 Insurance – nonprofits Lamb Financial Group
53 Law Adam Leitman Bailey P.C.
10 Legal services Sheppard Mullin
24 Legal services Cooley
46 Legal services Michelman & Robinson
62 Legal services Alston & Bird
81 Legal services Frankfurt Kurnit Klein & Selz
85 Legal services Reed Smith
20 Location intelligence services PlaceIQ
40 Manufacturer – socks Bombas
79 Market research BuzzBack
84 Marketing Firstborn
9 Marketing analysis software Unified
23 Marketing analytics Dynamic Yield
67 Marketing analytics Fluent
3 Marketing for influencers Cogent Entertainment Marketing
16 Marketing-data software mParticle
69 Media services Horizon Media
97 Media-monitoring software Meltwater
74 Mobile application developer Dom & Tom
50 Mobile gaming Dots
42 On-demand massages Zeel
25 Public relations Allison & Partners
100 Public relations CooperKatz & Co.
82 Real estate brokerage GFI Realty Services
31 Real estate info – Commercial CompStak
87 Real estate marketplace StreetEasy
1 Real estate services – Commercial Transwestern
15 Recruiting software Greenhouse Software
35 Salesforce.com consulting Silverline
95 Social-media monitoring Brandwatch
13 Software management BetterCloud
26 Software-development consulting Stride
51 Technology SiteCompli
54 Technology Rocketrip
55 Technology CB Insights
5 Telecommunications MASS Communications
37 Video marketing platform Innovid
11 Video-creation software Animoto
27 Video-on-demand services Hulu
70 Website-building software Squarespace
21 Window contracting Adler Windows
78 Worldwide auctions LiveAuctioneers

To subscribe to this blog, or its comments, or to search its contents or to forward it using G+, see the options at top right.