Showing posts with label New York State. Show all posts

Monday, June 1, 2020

TECH INNOVATION | Three Rays of Hope

June 1, 2020—The Business Incubator Association of New York State (BIANYS), a nonprofit trade association, was established in late 2005 and serves both as a meeting place for incubator professionals, including operators of accelerators and co-working spaces. It started with a biotech focus and now covers a broader spectrum of 100 tech-innovating incubators in all parts of the State. The 2020 Annual Meeting earlier today focused on adapting to the coronavirus. John Tepper Marlin, chief economist for three New York City Comptrollers and former senior economist in two sessions of the Joint Economic Committee of the Congress, was invited to talk about the economic impact of past disasters and paths back to normalcy. Here are his remarks earlier today:

9/11
Disasters take a huge toll on the national and state economies. But there are paths to recovery and these paths are evident now.

Terrorists struck New York City’s World Trade Center twice, in 1993 and 2001. The New York City Comptroller’s office prepared both estimates of the economic impact and I was the chief economist on duty in both cases. In 2001 the office's estimate, prepared within two weeks of the event, was close to $100 billion. This estimate was the basis for a $20 billion package of aid from the Federal Government.

A Kansas twister.
If our future looked bleak after the 9/11 attacks, the outlook is in many ways bleaker now. The Covid-19 pandemic affects the entire country, with 105,000 deaths so far. President Trump’s having shut down the Bush-Obama pandemic preparedness program contributed to this country’s having suffered more than one-fourth of world-wide deaths. The national May unemployment rate to be announced Friday morning is likely to approach or exceed 20 percent, nearing the highest rate of  the Great Depression. 

The high rate is likely to persist, because two months after our economic shutdown, more than one-fourth of the U.S. workforce has applied for unemployment insurance. By late June the eight-week PPP limit for forgiveness of an SBA loan will expire for first borrowers. No one should be surprised that some people in a country on edge have been all too ready to give the President what he seems to have been looking for, deadly confrontation on urban streets. 

High hopes, on the way to the City.
Ray of Hope 1. Washington will have to help with money and, eventually, leadership. Only the national government can afford to pay for major disasters. Even if a twister is only in a single state like Kansas, Washington helps out, because the national government effectively reinsures the states. During a pandemic, when human lives are at stake everywhere, the cost of the response must be put to one side. When the reckoning comes, Washington must play a big role. Why should Kansas “bail out” New York? Because: 

  • If New York City fails, the United States loses its biggest economic engine. 
  • As Governor Cuomo often observes, New York State sends many billions of dollars more to Washington every year than it gets back. New York “bails out” the rest of the country annually. 
  • New York State was the hardest hit because we are the gateway from the rest of the world. 
  • Only the Federal Government can print money and issue virtually costless debt, especially since the imposition of the cap on the SALT deduction in 2017.
"If I only had a brain."
The country desperately needs a better disaster preparedness brain in Washington. Governor Cuomo’s regional coalition of states is a brilliant temporary substitute. Disaster preparedness must not depend on which party or which official is in charge. It could be headed by a board nominated by the White House, Congress, National Governors Association and nonprofits dedicated to disaster relief.  My first hope is that analytical tools are being generated now by today’s startups that will allow us to respond faster and better in future. 


The cowardly lion.
Ray of Hope 2. Disasters cause lasting trauma. But the causes and becoming better understood.  Most vulnerable are young people, front-line workers and those who suffer from business interruption. Trauma in a disaster affects workers, their families and even onlookers. State and local front-line staff such as police, fire fighters, teachers and health care workers are under high stress in a   disaster. In financial disasters, the victims may be owners of declining financial assets. Shock suffered by survivors and even remote observers is serious and can be long-lasting. Recent estimates of the impact of the coronavirus suggest that the impact extends to one-fourth to one-third of the population with measurably serious increases in levels of anxiety and depression. Young people whose career paths are interrupted are at risk. So are  business managers faced with closure of their stores or hospitality centers. Huge office buildings in Westchester and Northern New Jersey testify to fears among businesses headquartered in Manhattan that they would have to leave after 9/11. Mayor Michael Bloomberg’s great contribution to New York City was to restore faith among business leaders in New York City's future. In the 2020 pandemic, the dominant uncertainties include the future of bars, restaurants and retail stores; the shift in consumption from physical stores to online purchases; and fear of acquiring illness on public transportation. For problem-solving startups, the ray of hope is in developing new design approaches to spaces so that the public has confidence in returning, or new software apps that allow transactions to be conducted entirely in advance. This will hasten safe reopening. 

"If I only had a heart."
Ray of Hope 3. Tech systems have become the heart of American commerce and industry. Disasters pose special tech ricks for businesses. They are being tackled one by one. Risk managers know that tech assets are increasingly where values are concentrated. Large businesses have  multibillion-dollar IT investments, which have become more valuable than the buildings in which they reside. Businesses are properly concerned to back up their data and avoid getting hacked. Back-up systems in the World Trade Center were sometimes in the same building, so the backups were lost in the attack. Putting the NYC emergency command center in one of the WTC buildings was a concentration of risks that many spotted. Broad-based “cloud” storage promises more security, but we don’t know how well it will survive a cyberattack on our electrical grid or a bomb planted by a terrorist. Making our web storage vandal-resistant is a key opportunity for startups. While startups are fragile and at special risk when financing dries up in a disaster, those that survive will find many opportunities awaiting them. Competitors seek to merge and buyers will find fewer vendors in the same space.

To sum up:

  • The country needs tech startups that address our lack of preparedness for  disasters. Opportunities abound for innovation in meeting the specific disasters before the country now, and others that are predictably in our future.
  • Incubators and accelerators make a great contribution by helping to form teams, to advise on project planning, to connect with expertise, and to enable startups to bridge the gap between ideas and financing.
  • Because incubators process many startups, they increase the probability in a risky environment that at least some of the investment in new ideas will come to fruition. They are therefore a good bet for foundation grants, angel investors and government loans and grants.


Thursday, April 23, 2020

PANDEMIC | Global to Local Data

Global

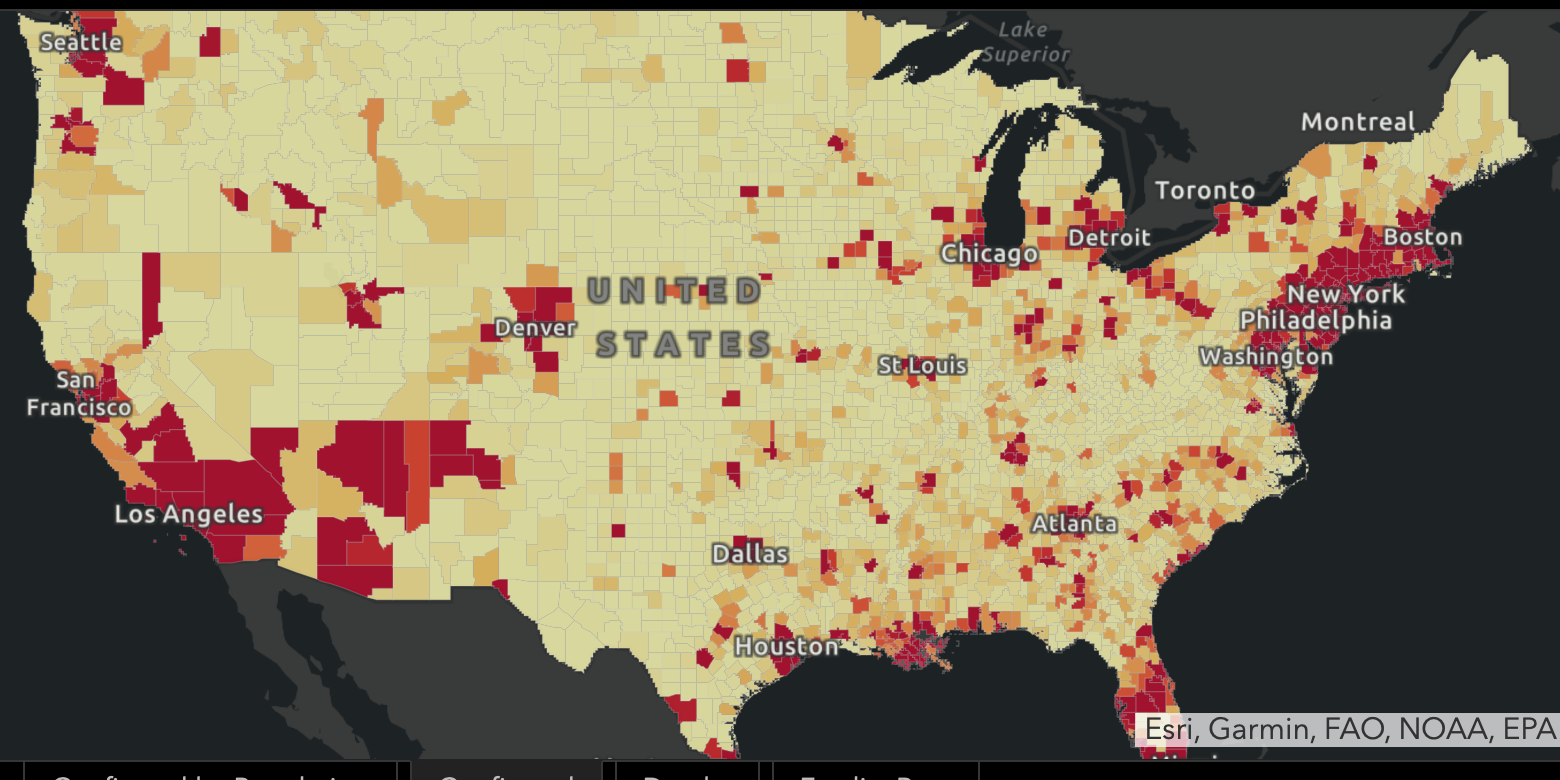
The map and table below show that the United States is by far the most affected based on confirmed/reported cases of Covid-19.  The first is from the New York Times, April 24.
The second is from Johns Hopkins University's website.
Worldwide, Confirmed and Reported Cases, Johns Hopkins University Map, April 24, 2020.
Total cases confirmed worldwide as of Friday morning, April 24: 2.7 million. The most confirmed/reported cases now are in these five countries:
1. 869,170 United States
2. 213,024 Spain
3. 189,973 Italy
4. 159,460 France
5. 153,129 Germany
6. 139,246 United Kingdom

United States

The map and table below show that New York State and New Jersey have been taking the brunt of the impact of the virus, with nearly 21,000 deaths in New York.


USA Confirmed Cases, Johns Hopkins University Map, April 24, 2020.
Top ten states by confirmed cases (from the The Guardian, April 24, 2020)

New York State


This map and table shows that within New York State, the incidence of cases by county is highest in New York City and surrounding counties, where the density is highest. Nassau and Suffolk both have about 30,000 reported cases of the coronavirus, both about 2,000 cases per 100,000 population (2 percent), but Nassau has many more deaths relative to the number of cases.


New York City and Top Five Counties by Reported Cases and Deaths (New York Times)


Suffolk County (NYS Department of Health), Towns


The map and table below show that the high concentration of Covid-19 cases are on the western end of the county, where the density is higher. The Town of Islip has the highest count of cases.


Source: Bonac TRS, April 23, 2020

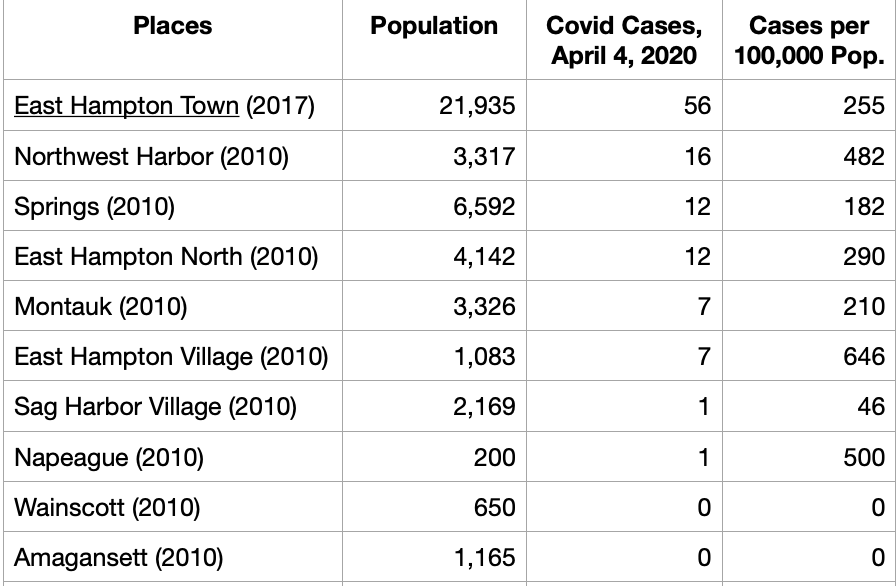
East Hampton Town

This table shows that East Hampton Town has been spared so far any deaths but the Village has a high number of cases relative to the residential population. This reflects the fact that the Village is a commercial center with continuig interaction.

East Hampton Town, Census Places (Hamlets and Villages)
Compared with Global, U.S., NYS, NYC, Nassau County and Suffolk County
Source: Data from previously cited sources. Computations by CityEconomist.

Sunday, April 5, 2020

NY STATE | County Cases, Deaths from COVID (3)

April 6, 2020—Nassau County's death rate from COVID-19 has nearly caught up with New York City's 29.3 deaths per 100,000 population as of early-morning data.

New York City's five counties and five other counties – Nassau, Rockland, Westchester, Orange and Suffolk – dominate the figures.

Deaths in Large Counties as of April 5. The large population of both New York City's five counties and Nassau County have raised the statewide average death rate to 21.2, as shown int he first table. The only other county in the state to be above the state average is Rockland. Westchester is now just below the state average, followed by Orange County and Suffolk County. No other county in New York State comes close to these ten counties.


This is an update of two earlier posts on NY County data, April 3 and March 27. It utilizes the interactive database of the New York Times. See earlier posts for references and notes.

Deaths by Age Group and Gender. The second table shows how a pattern is already forming in the data, with the largest number of victims being over 70 and male. 11.4 percent of the fatalities were patients 90 and over, 26.9 percent 80 and over, and 53.4 percent were 70 and over. By gender, 61 percent of the deaths were men.

Source: Fatalities from NYS Department of Health. Population data from U.S. Census Bureau (2018). American Community Survey 1-year estimates. Retrieved from Census Reporter Profile page for Suffolk County, NY. Also used data from Towncharts.com and combined data to estimate the population by age ranges.
East Hampton Town. The COVID-19 cases in the hamlets and villages and other designated census places within the Town, as of April 4, 2020, show that the largest concentration of cases are in the Village of East Hampton. So far there are no reported deaths in the Town of East Hampton.


Update, April 8, 2020—The number of cases rose to:

Suffolk County 17,444 (Deaths, 323).

EAST HAMPTON TOWN, 75. (No reported deaths.)
Northwest Harbor, 17Springs, 17East Hampton North, 18Montauk, 10East Hampton Village, 10Sag Harbor Village, 1Napeague, 2Wainscott, 0Amagansett, 0

Friday, April 3, 2020

NY STATE | County Deaths from COVID (2)

April 3, 2020—In one week, the death rate from COVID-19 per 100,000 population tripled in New York City. It was between 5.5 and 5.8 deaths per 100,000 population in the Bronx, Staten Island (Richmond County) and Queens, and was 3.2 to 3.5 in Brooklyn and Manhattan. See prior post, one week ago.

Rockland again had the highest death rate outside of New York City, rising from 1.6 to 13.5, a huge increase of nearly tenfold. Nassau, which had been behind Suffolk last week, rose from 0.7 deaths per 100,000 to 10.3, an increase of nearly 15-fold. Suffolk's death rate rose five-fold. Westchester's death rate rose from 0.1 per 100,000 to 7.1, a 71-fold increase...
Sources: New York Times Interactive for population data except NYS and NYC, Cases per 100,000 pop. and Deaths. NY State Population from World Population Review as of 2020-02-17, retrieved 2020-04-03.  NY City population as of 2019, Census estimate. Death rates computed by JTM.
The Centers for Disease Control and Prevention (CDC) has found the same pattern emerging in the United States as has prevailed in other countries in Asia and Europe, namely the hardest hit are the older age groups.

Especially vulnerable are those 85 and older, for whom the death rate is more than 10 percent of the number of confirmed cases.

This is why so many cases and deaths are being found in nursing homes.

Wednesday, September 12, 2018

DEMOCRATIC PRIMARY NY | Fake Democratic Senators

A Primary is being held today in New York State. The Independent Democratic Conference, or IDC, was composed of Democratic State Senators who caucused separately from other Democrats, and voted with Republicans. They are sham Democrats and have had a pernicious role in Albany.

The following guide to identifying them was provided to me by Heidi Fiske. Vote for the real Democrats, not the sham IDC.


Monday, November 23, 2015

WINE BIZ | NY State Planning to Do a Bad Thing

The SLA's action will reduce wine choices. You may
have to settle for worse wine... or move to another state.
I mean, what's really important to you?
The New York State Liquor Authority (SLA) has sent out an Advisory that will change the state beverage law.

It would change how wine lists in top restaurants are written in the state. 

It would destroy the reputation that NY State enjoys as having the best wine lists in restaurants.

More on this story here. The NYS SLA wants comments within a few weeks.


Thursday, August 20, 2015

NYC | Leads NYS the State in July

New York State's private jobs grew in July to 7,831,700, a new record high, says the NYS Department of Labor today.

NYS unemployment rate fell to 5.4 percent from from 5.5 percent. The July rate is the lowest rate in  NYS since July 2008. 

New York City’s unemployment rate dropped to 5.6 percent from 6.1 percent, its lowest rate since August 2008.

The unemployment rate is estimated based on a monthly survey of 3,100 households in the state.

New York State kept pace with the United States in July. Both private-sector and total (including government) jobs grew at 0.2 percent compared with the month before.

                  Jobs, Nonfarm, June-July 2015, US and NYS
Change, Nonfarm Jobs:
(private sector + government)
Change,
Private Sector Jobs:


United States                    +215,000    
           +210,000
New York State                      +19,000
             +19,300

The number of unemployed in New York State decreased in July 2015 to 519,300 from 537,400 in June. The gap between New York State and New York City has greatly narrowed. New York State's unemployment rate fell 0.7 of a percentage point from a year earlier and New York City's fell 1.3 percentage points.

Unemployment Rates (%)*
*Data are preliminary and subject to change, based on standard procedures outlined by the U.S. Bureau of Labor Statistics.
July 2015*June 2015July 2014
United States5.3 5.36.2
New York State5.45.56.1
New York City5.76.17.0
NYS, outside NYC5.15.15.5

Compared with July 2014, the growth in jobs in New York State outpaced national growth. New York City led the state.

Change in Total Nonfarm and Private Sector Jobs, July 2014 – July 2015
Change in
Total Nonfarm Jobs:

(private sector + government)
Change in
Private Sector Jobs:
Net
%
Net
%
United States+2,953,000+2.1%+2,868,000+2.4%
New York State+189,700+2.1%+189,000+2.5%
    Albany-Schenectady-Troy+7,800+1.7%+7,200+2.0%
    Binghamton00.0%00.0%
    Buffalo-Niagara Falls+12,600+2.3%+12,800+2.7%
    Dutchess-Putnam+400+0.3%+700+0.6%
    Elmira+600+1.6%+700+2.2%
    Glens Falls+900+1.5%+900+1.8%
    Ithaca+1,100+1.7%+1,400+2.5%
    Kingston+600+1.0%+600+1.3%
    Nassau-Suffolk+19,200+1.5%+19,900+1.8%
    New York City+111,200+2.7%+107,800+3.0%
    Orange-Rockland-Westchester+8,400+1.2%+9,100+1.6%
    Rochester+9,300+1.8%+9,700+2.2%
    Syracuse+2,700+0.9%+2,800+1.1%
    Utica-Rome+900+0.7%+1,000+1.0%
    Watertown-Fort Drum-200-0.5%-400-1.2%
    Non-metro Counties-2000.0%-800-0.2%

Monday, February 9, 2015

NY | 3/5 Cigs Are Smuggled

In 15 states, more than 1 in 5 cigarettes are smuggled. 
In NY State, it's 3 in 5.
The sale of smuggled cigarettes is on the rise nationwide, according to the latest report from the Tax Foundation, an NGO that promotes lower taxes.

The thrust of the report is that state and local governments that increase taxes on tobacco products have created lucrative incentives for black market cigarette trafficking between states. 

As a result, the sale of smuggled cigarettes is on the rise nationwide.

Cigarette taxes are Pigou taxes, which have benefits. They discourage behavior that is bad for public health or reduces the productivity of workers. They raise revenue to offset the higher spending on health care by federal and state governments created by cigarette smoking by paying for remedies for the behavior and for preventive programs. However:
  • A Pigou tax doesn't work as it should if it is not collected. It neither discourages the costly behavior nor does it pay for solutions.
  • To be specific, New York's Governor Cuomo and Speaker Heastie could help New York State could pay for a lot of things in the budget - or reduce other taxes - if they strengthened programs to collect the lost cigarette tax revenue, which in 2015 may be in the $3 billion range.
The report uses data on smuggling from the Mackinac Center for Public Policy.
  • New York State has the highest rate of inbound cigarette smuggling, 58.0 percent.
  • The states that are the next most dependent on contraband cigarettes are: Arizona (49.3 percent), Washington (46.4 percent), New Mexico (46.1 percent), and Rhode Island (32.0 percent)
  • On the outbound side, the state with the most outbound smuggling is New Hampshire - 28.6 cigarettes are smuggled out for every 100 sold.
  • The states with the next-highest outbound smuggling rates are Idaho (24.2 percent), Virginia (22.6 percent), Delaware (22.6 percent), and Wyoming (21.0 percent).
Postscript

Michael Phillips, who is kind enough to watch what I say on this blog and to tell me when he thinks I have it wrong, queries in the comments below whether taxes and regulations against smoking are working. He argues that they are not and evil side effects such as the black market in cigarettes (Eric Garner was selling single untaxed cigarettes) are being ignored.

Michael doesn't provide sources. However, my information is that 45 percent of American adults used to smoke and the Centers for Disease Control reports that, as of 2013, the figure recently broke through the 20 percent floor for all American adults:

Overall, about 18 of every 100 American adults (17.8%) smokes - a reduction of 27 percentage points - pretty significant. The proportion of people who smoke varies for different groups:
  • A shade more than 20 of every 100 adult men (20.5%)
  • About 15 of every 100 adult women (15.3%)
  • Nearly 19 of every 100 adults aged 18–24 years (18.7%)
  • About 20 of every 100 adults aged 25–44 years (20.1%)
  • Nearly 20 of every 100 adults aged 45–64 years (19.9%)
  • Nearly 9 of every 100 adults aged 65 years and older (8.8%)
(In the report, current smokers are defined as persons who reported smoking at least 100 cigarettes during their lifetime and who, at the time they participated in a survey about this topic, reported smoking every day or some days.)


The New York Times has just editorialized that smoking is even worse for us than we thought. There are still 42 million Americans who smoke. We should be doing more to reduce smoking, not less.

Wednesday, October 29, 2014

JOBS | Metro NY and NJ

September data on Metro Area non-farm jobs shows an increase of 130,500 jobs in the Greater New York area, which includes all of Long Island. This is the best performance of metro areas in New York State. In fact, jobs grew substantially in New York State only in the Hudson River corridor from New York City through Kingston to Albany.
Metropolitan area
State
Sept. 2013 
(‘000)
Sept. 2014(p) (‘000)
 Change (‘000)
Change (%)
Trenton-Ewing, NJ
New Jersey
247.2
252.0
4.8
1.9
Ocean City, NJ
New Jersey
46.8
47.2
0.4
0.9
Vineland-Millville-Bridgeton, NJ
New Jersey
57.3
57.8
0.5
0.9
Atlantic City-Hammonton, NJ
New Jersey
138.7
128.7
-10.0
-7.2
New York-Northern New Jersey-Long Island, NY-NJ-PA
New York
8,710.1
8,840.6
130.5
1.5
Kingston, NY
New York
60.3
60.8
0.5
0.8
Albany-Schenectady-Troy, NY
New York
448.2
451.3
3.1
0.7
Buffalo-Niagara Falls, NY
New York
551.9
554.5
2.6
0.5
Elmira, NY
New York
38.7
38.8
0.1
0.3
Poughkeepsie-Newburgh-Middletown, NY
New York
254.0
254.4
0.4
0.2
Ithaca, NY
New York
70.4
70.5
0.1
0.1
Rochester, NY
New York
515.7
516.2
0.5
0.1
Binghamton, NY
New York
106.3
106.1
-0.2
-0.2
Glens Falls, NY
New York
55.0
54.8
-0.2
-0.4
Syracuse, NY
New York
317.3
316.1
-1.2
-0.4
Utica-Rome, NY
New York
128.0
127.3
-0.7
-0.5
Source: BLS Metro Areas report, October 29, 2014.

In New Jersey, the state capital, as in New York State, gained jobs but growth was weaker in the rest of the state. Atlantic City remains in economic crisis, losing 7.2 percent of its jobs, 10,000 of them, in the year ending September 2014.

For cities, density remains destiny. The bigger cities survive economic downturns best, and so do state capitals, where the state taxes go.