Showing posts with label economic impact. Show all posts

Wednesday, March 18, 2020

PANDEMIC | The Economic Impact of the Virus


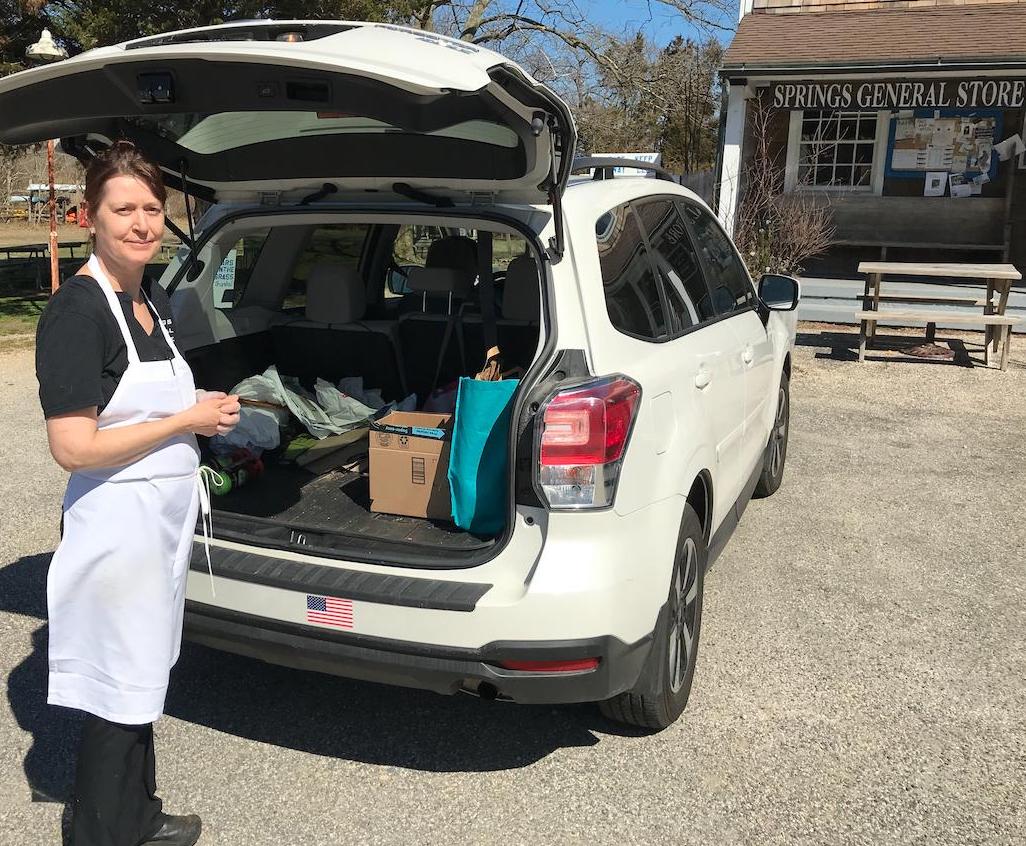
Kristi Hood loads up groceries for a self-quarantining
family. This is a new service of  the Springs
General Store. Photo by John Tepper Marlin.


PS. Here are some followup stories in the East Hampton Star. As a public service, the newspaper has a free alert on the coronavirus as it affects the Town of East Hampton and Suffolk County generally:

Suffolk Hospitals Face "Herculean" Task as Virus Numbers Grow (March 24, 2020).

Tuesday, January 26, 2016

COST OF 9/11 | Gulf War II–a Non Sequitur?

New York Times, Sept. 12, 2001.
New York Times story by Andrew Ross Sorkin published online on Nov. 16, 2015 and in print on Nov. 17 (pp. B1 and B4) estimates the total cost of 9/11 to the USA as potentially "as high as $3.3 trillion."

$3.3 Trillion?

That seemed like a lot to me. The final estimates of the total cost to New York City came in at $70-$80 billion, after the initial estimates of deaths were cut in half and the damage to the hotel next to the World Trade Center was found not to be as bad as feared.

Much of the damage was, of course, paid for by insurance payouts–and, of course, terrorism insurance premiums then soared, or deductibles, or both.

Federal assistance to the City also helped, with $20 billion promised and a good portion of that delivered.

The Basic Costs: Physical and Economic

The total cost is defined as the "economic cost of Sept. 11" to the entire United States. The estimate starts with $178 billion for the physical and economic costs–$55 billion for physical losses and $123 billion for economic losses. These numbers are in the ballpark, although shifting the focus from New York City to the nation cancels out economic costs to NYC that were premised on corporations moving jobs out of New York City (e.g., for New Jersey or Westchester). Many of these jobs came back, but that was not at all the most likely scenario back in 2001 when I worked on these numbers as chief economist for the NYC Comptroller's Office.

These two basic physical and economic cost numbers are relatively easy to understand from examples:

  • When buildings are destroyed, America's wealth declines and resources are diverted from the rest of the economy to replace them. 
  • When airports are closed all across the United States, the impact on the national economy is also obvious (think about the impact on tourism in Hawaii and Nevada, for example).
Costs of the U.S. Response to 9/11

Sorkin goes on to hike the number from $178 billion to $3.28 trillion, with two other "costs"that are the sum of the consequences of two decisions by the then-President of the United States:
  1. To go to war in Iraq ($2.516 trillion). The Second Gulf War began with the President's decision to retaliate against Iraq for building alleged weapons of mass destruction. The decision was controversial at the time and still is. The $2.5 trillion price tag for the second Gulf War may even be a lowball estimate if the United States stays in Iraq and Afghanistan and keeps spending in this arena. Whether one considers the decision war as justified or not, the spending on it cannot be described as an inevitable consequence of 9/11. It was a consequence of how the nation responded.
  2. To create the Department of Homeland Security ($589 billion). The new department is a reshuffling of existing agencies. Something had to be done at the Federal level to respond to the failures of intelligence that allowed successful acts of destruction on 9/11. But the size of new domestic security spending grew because of the same controversial information that led to the Second Gulf War. 
These "costs" are real. The numbers are in line with those that Linda Bilmes and Joe Stiglitz put forward as the cost of the Second Gulf War (the beginning of the First Gulf War just celebrated its 25th anniversary). But it is inappropriate to call them the "costs of 9/11". The 9/11 attack may have created a climate that created support in Congress for going to war again in Iraq and overhauling domestic security agencies. But it was not a sufficient cause. It was not a consequence of 9/11 in the same way as destruction of buildings and interruption of economic activity. It was a non sequitur.

Monday, November 16, 2015

LOSS | Terror Attacks – Paris vs. 9/11

The Physical-Human Losses to Paris Were Smaller than to NYC
 on 9/11, but Economic Losses May Be Greater Relative to Size.
November 16, 2015–As the chief economist for two different New York City Comptrollers in 1993 and 2001, I was required to prepare official numbers for the economic loss to New York City of both of the terrorist attacks on the World Trade Center.

A colleague has asked me – "How do the economic losses from the Paris attacks compare with the New York City numbers for 9/11?"

NYC,  2001. Business leaders in New York City were fearful after both attacks.
  • In 1993 it had been comforting that the attack could be dismissed as "the gang that couldn't shoot straight" because the explosives did relatively little damage to the World Trade Center (one post protected the next) and the driver of the rented truck used in the bombing tried to get back his deposit! He was of course quickly apprehended.
  • In 2001, it was 100 times worse. The cost of higher insurance premiums and deductibles in 2001, the cost of installing new security protections in offices and residences all over New York City and alternative sites in suburban areas, was far greater. That doesn't take into account the national response of launching a military attack on Iraq. The first official estimate in 2001 of the economic loss to New York City of 9/11 was made within two weeks. It was in a range of $95 to $105 billion, approximately 100 times the economic impact of the 1993 attack. 
The first estimate was made when the loss of life from the World Trade Center alone was believed to be close to 6,000 people. The approach was to estimate the one-time loss of buildings, property and lifetime earnings of people who were killed, and then to add to this the present value of adverse business-location decisions.

Within three months, by the end of 2001, the business consensus on the economic impact settled at about $80 billion, about 8 percent of NYC's current gross product.  The drop in the economic impact estimate occurred because:
  • As more survivors were identified, the estimate of the number of dead was lowered from 6,000 to 3,000 (including deaths from the Pentagon attack and all four crashed planes).  
  • Early on, the fear was that many businesses would relocate to New Jersey and Westchester County. In fact, many large companies acquired alternative office space in these areas. But few moved out.
  • With the election as Mayor in November of a successful member of their own fraternity – Michael Bloomberg – business leaders believed that their fears would be addressed fully and competently.
Paris, 2015.  The threat to Paris and to France from terrorism is greater than in New York City and the United States:
  • France is more dependent on Paris than the United States is on New York City. The NYC metro area accounts for 8 percent of U.S. gross product, whereas Paris accounts for one-fourth of French gross product. 
  • France is much more dependent on tourist revenue than the United States, and Paris is the main gateway.
  • The $17 trillion U.S. economy has well-monitored borders with Mexico and Canada and has invested heavily in Homeland Security. The less-than-$3 trillion French economy must cope with borders – in places porous – with Belgium, Luxembourg, Germany, Switzerland, Italy and Spain, not to mention the high volume of traffic to and from Britain. France has reportedly  suspended its commitment to the Schengen Agreement on open borders, which will entail new costs.
On the other hand, the regional and national alternatives to NYC for large American businesses are greater than for businesses in Paris that wish to remain in a francophone environment. It would probably be harder to pull up stakes from Paris and move to a suburban location or another French city because Paris uniquely dominates France, as London dominates Britain.

Based on these considerations, the Paris of the Hebdo and November terrorist attacks could add up to an economic loss for Paris less than but approaching the percentage estimated for the 9/11 attacks. The 8 percent figure applied to the metropolitan Paris economy would come to nearly $6 billion.

The USA and France.  The attack imposed large costs on the Federal Government – on the Federal Reserve System to fund the liquidity crisis immediately after the attack as well as a $20 billion commitment of grants and loans by the Federal Government to compensate New York City for losses in what was properly considered an act of war.

The cost of the damage to New York City was also spread to the rest of the country via private insurance payouts (insurers were not allowed to hide behind Act of God or Act of War clauses) and higher insurance premiums,

An interesting 2010 article in the journal Peace Economy, Peace Science and Public Policy by USC and Claremont economic professors Adam Z. Rose and S. Brock Blomberg, “Total Economic Consequences of Terrorist Attacks: Insights from 9/11”, concludes that the initial economic loss to the USA from 9/11 was at least $75 billion, or three-quarters of a percent of GDP.  This is not necessarily inconsistent with the New York City number because migrations of businesses out of New York City within the United States would not be a loss to the United States, so the national number could well be smaller than the local number at the center of the attack.

The authors make an important point that was always clear to me, namely that psychological factors are crucial for determining the ultimate economic loss from an attack. As they say:
[W]e, rather than the perpetrators, are the major determinant of the consequences of a major terrorist attack. After 9/11, our resilience was high, but so was our fear [... ]. [S]ubsequent anti-terrorist initiatives at home and abroad were more costly than the direct damage caused by the attack.
The United States has invested $650 billion since 2001 in Homeland Security. The French commitment before the latest attack was a little more than one-thousandth of that. France will have to spend more, and the United States needs to assist. American concern about terrorism is greater now than it was after the Boston Marathon attack.

Tuesday, October 30, 2012

Hurricane Sandy - 5th, 6th Most Severe?


How will Hurricane Sandy rank in severity, for example, compared with Hurricane Irene? A number of estimates are already appearing and estimates of insured losses have been growing beyond the first estimate of $10 billion, which would imply a total cost of approximately $25 billion using a rule of thumb described below.

In 2011, Hurricane Irene was described as being the fifth-costliest hurricane in U.S. history. I didn't believe it, and I checked it out. This number should not be used. Hurricane Irene does not even rank among the ten most costly. A dollar ranking that does not adjust for inflation is just not useful.

The suggestion has already been made that Hurricane Sandy will be the costliest East Coast hurricane ever. Some superlatives have been used:
-          The MTA says Sandy is its worst disaster ever because of the corrosive nature of the salt water from floods on its tracks.
-          Con Ed says this its worst disaster ever.
-          On Long Island, 90 percent of LIPA customers are without power.
-          The Wall Street Journal posted satellite photos showing Sandy is larger than Irene.
-           
The WSJ concludes that Sandy will cost more than its estimate of a $15 billion cost for Irene. NY Governor Cuomo has observed that the cost of Irene was mostly upstate, whereas the cost of Sandy is downstate.

Prospective Measures of Severity

The significance of an oncoming storm is now estimated by meteorologists based on wind-speed categories and barometric pressure. The two measures are interrelated and point to likely wind speeds. The public needs also an indicator of the likely economic impact of flooding.

1. Five Wind-Speed Categories. A Category 1 hurricane means wind speeds of 74-95 mph on the Saffir/Simpson Hurricane Scale. The categories go up to 5 for wind speeds above 155 mph. Hurricane Irene petered out on its way north. The warm air carried by Hurricane Sandy on its way north met another storm with cold air from the northwest.

2. Millibars - Barometric Pressure. The Christian Science Monitor has posted a lucid summary of the importance of this measure of hurricane severity. (It also repeats the error cited above about the cost of Hurricane Irene - I will return to this.) Ordinarily, the barometric pressure is related to wind speed. The normal sea-level barometric pressure is 1013.5. During a hurricane the eye of the storm shows the lowest barometric pressure. The lower the pressure, the higher the winds. During the afternoon before Sandy hit landfall, the barometric pressure at its eye fell from 943 to 940, which is a level associated with Category 3 or Category 4 winds. The lowest barometric pressure that has been measured in a U.S. hurricane is 882 for Hurricane Wilma. Hurricane Carla was the tenth-lowest, 931. The National Hurricane Center list of the most intense Atlantic hurricanes does not follow the Millibars ranking exactly, since Katrina and Wilma are not in the order one would expect.

      Ten Windiest (“Most Intense”) Hurricanes

Name (after 1953) or Location
Year
Category
Millibars
1.Florida Keys
1935
5
892
2.Camille
1969
5
909
3.Katrina
2005
3
920
4.Andrew
1992
5
922
5.Indianola, TX
1886
4
925
6.Keys, FL
1919
4
927
7.Lake Okeechobee, FL
1928
4
929
8.Donna
1960
4
930
8.Miami, FL
1926
4
931
10.Carla
1961
4
931
Notes: Wind Category is at Landfall. Category 5 on the Saffir/Simpson scale means 155 mph winds for at least one minute. Category 4 means 131-154 mph for at least one minute. Category 3 means 111-130 mph for at least one minute.  Millibars are mercury readings for barometric pressure. Source: Based on NOAA, National Weather Service, National Hurricane CenterBlake and Gibney, 2011.

3. Flood Surge Impact. However, most of the damage is caused by the delayed impact of the flooding surge (the hurricane equivalent of a post-earthquake tsunami). We need a new indicator of likely flood damage, which would have to take into account the economic value of property in the track of the hurricane, the sea level of the land, and the size of the expected surge.  The Flood Surge Impact index could take into account the timing of the tides – Hurricane Sandy hit landfall near high tide and the full moon added to the height of the tide and therefore to the surge. The geography of the surge was important in the case of New York City because the surge came from two directions – down the Connecticut coastline through the Long Island Sound and northward through the funnel of New York Harbor.

Retrospective Measures of Cost

There are at least six basic ways to measure or adjust the cost of a hurricane. They overlap:

1. Loss of Life, or Injury.  While every life is precious, on the simple measure of number of lives lost to a hurricane, Hurricane Irene's 24 lives lost did not even rank among the 100 most costly hurricanes. Preparedness is much better than it used to be, and evacuation is widely recommended. Mayor Bloomberg has made clear that the overriding priority of the City of NY is to avoid loss of life among residents and emergency workers. The mayor has taken a scientific approach to evacuation based on flood probability maps that use feet above sea level a proximity to water to create three evacuation zones. These maps proved highly predictive. Also contributing to reduced fatalities is the steady improvement in (a) U.S. Government warning systems via NOAA and its National Weather Service and National Hurricane Center, and (b) the FEMA network of state notification and assistance.  Loss of life can be converted to a dollar figure via life insurance losses or a value that economists impute to a person's remaining working life. Injuries also represent a cost either to the individual or to health insurance plans (private or governmental), and injuries that result in a disability have a working-life cost that can be attached.

The final number for lives lost from Hurricane Irene appears to be 24. Just one of the deaths was in New York City. The deadliest Atlantic hurricane since 1900 was in Galveston, in 1900, with a range of between 8,000 and 12,000 deaths.

    Five Deadliest Atlantic Hurricanes Since 1900
Name or Location, Category
Year
Deaths
1. Galveston, TX, 1900, Category 4
1900
8,000-12,000
2. Lake Okeechobee, FL, 1928, Cat. 4
1928
2,500-3,000
3. Katrina, Category 3
2005
1,200
4. Florida Keys, Category 4
1919
600 (287 land)
5. Long Island Express (Great NE), Cat. 3
1938
600 (256 land)
Source: NOAA, National Weather Service, National Hurricane CenterBlake and Gibney, 2011. The National Weather Service started giving names to hurricanes in 1953. 

The fifth-deadliest was the 1938 Long Island Express. On the criterion of deadliness, Hurricane Irene did not qualify as one of the five most severe.

2. Loss of Physical Property.  Property can be destroyed by wind or flooding or a combination. This means a loss of wealth of the property owner. If the loss is charged against revenue, it means a loss of revenue. (A building may be a depreciated asset; loss of inventory is likely to be expensed.) The first impact may be flying debris, the lifting off of roofs, the flattening of flimsily constructed buildings. The delayed effects include (a) loss of electricity from downed power lines, which means that many perishables have to be thrown out, and (b) flooding, which destroys or rends temporarily useless all kinds of property such as books and electronics, especially if the flooding is from salt water, which MTA Chairman Joe Lhota and Con Ed Chairman Kevin Burke say is especially damaging to power connections, create huge problems for electricity supply and transportation infrastructure.

3. Business Interruption. The delayed effects of a hurricane also include business interruption. Increasingly, businesses insure not only against loss of property but the loss in profits that comes from an interrupted business. When a restaurant or a theater remains closed because of floods that prevent people from showing up, it is hard to make up the loss because the business space has a limited capacity. That is something that is not fully taken into account by those who look for a large rebound after a disaster, as might be true of a retail store that offers a post-hurricane sale. Some kinds of losses are much harder to make up Figures on the cost of hurricanes increasingly include business-interruption losses, which bias upward the later numbers – another reason it is so important to adjust for inflation as discussed below.

4. Insured vs. Uninsured Private Losses. Insurance companies are most interested in the total of insured losses. But from an economic perspective, losses to individuals (e.g., workers paid by the hour) are real. The money that would have been spent in the community by the individuals is missing. The National Hurricane Center uses a simple formula to estimate uninsured losses - it doubles the number for insured losses.

5. Government Losses. At the national level, flood insurance is provided by the National Flood Insurance Program. Individuals pay a premium for this insurance, which would otherwise not be available. After a hurricane, there will be payouts and a loss that may exceed cumulative premiums. The National Hurricane Center in its estimate of damage adds in the number for flood damage provided by the National Flood Insurance Program. FEMA programs provide relief to local governments and individuals. Other Federal bodies (the dewatering unit of the Army Corps of Engineers, for example), states (emergency response teams) and localities (police, fire, sanitation, ambulance) must also be factored in as costs of a disaster.

6. Adjustments for Inflation or Growth in Business Activity. Two kinds of adjustments are typically made to comparisons among hurricanes. One is to adjust cost figures for inflation. The Christian Science Monitor story cited above incorrectly describes Hurricane Irene as the fifth mostly costly hurricane in U.S. history. As I explained last year, that label only works if we are under the delusion that a dollar 100 years ago should be valued the same as a dollar today. (Apart from the fact that business-interruption costs are increasingly included in hurricane losses, adding to the size of the numbers.)  There are widely available cost-of-living indicators to refer to, such as this one from the BLS. Business activity measures are used to relate hurricane damage to the value of the real estate through which the hurricane travels. This is a good predictor of cost and is also a factor to consider in comparing the impact of a hurricane traveling the same path in different years.

Total Economic Damage

The deadliest hurricanes are not always the costliest in terms of property loss or business interruption.

The ten costliest Atlantic hurricanes are listed below with their estimated damage. Total estimated damage includes insured and uninsured losses. A rule of thumb is that uninsured losses equal insured losses. So if an insurance association or forecaster estimates that insured losses are $10 billion, then total private losses (insured plus uninsured) are commonly estimated at $20 billion. In addition, losses are borne by Federal, state and local governments – the cost of special national insurance programs like flood insurance, or the cost of FEMA assistance, or the cost to states and localities of the overtime of emergency assistance personnel or the damage to public infrastructure.

Note that earlier estimates are generally based on physical damage only, whereas later economic impact numbers, after WWII, include impacts such as business-interruption costs because these became widely insured events.

In addition, dollar-value rankings must be adjusted for inflation. There is no sense in unadjusted dollar numbers that go back to 1900. The most costly U.S. hurricane ever was the 1926 Miami Hurricane, which cost $165 billion in 2010 dollars according to the National Hurricane Center.

       Ten Costliest Hurricanes (pre-Sandy)
Rank
Hurricane
Year
$bil. (2010 $)
1
Great Miami
1926
164.8
2
Katrina
2005
113.4
3
Galveston
1900
104.3
4
Galveston
1915
71.4
5
Andrew
1992
60.5
6
L.I. Express
1938
41.1
7
SW Florida
1944
40.6
8
Lake Okeechobee
1928
35.3
9
Ike
2008
29.5
10
Donna
1960
28.2
Source: NOAA, National Weather Service, National Hurricane Center, Pielke et al. (R. A. Pielke, Jr., J. Gratz, C.W. Landsea, D. Collins, M. Saunders, and R. Musulin, 2008: "Normalized Hurricane Damages in the U.S.: 1900-2005." Natural Hazards Review, 9, 29-42, cited in Blake and Gibney, 2011). Pielke et al. adjust historical data for inflation to 2010, wealth per capita and population. The adjustment for inflation is essential. 

Hurricane Irene's estimated cost was $15 billion. Clearly, it does not rank among the ten most costly hurricanes. However, Hurricane Sandy will surely do so. The key is insured losses and government losses. If Hurricane Sandy ends up with insured losses above $15 billion, the economic impact could end up at about $38 billion, and it will rank #8, between the SW Florida Hurricane of 1944 and the Lake Okeechobee Hurricane of 1928. But if insured losses approach $20 billion, the cost of Hurricane Sandy will end up above the 1938 Long Island Express, and would rank #6. If insured losses exceed $25 billion, it could rank ahead of Hurricane Andrew, at #5.

Sunday, August 28, 2011

IRENE | How Bad Was She? Metrics

Wall of Water, East Hampton
My photo, August 28, 2011
A day after Hurrican Irene was downgraded to a Tropical Storm, 21 fatalities have been reported. Each of these  deaths represents a family tragedy and a huge loss for survivors. But in the business of measuring the economic impact of events–which I actively engaged in for 13 years while serving as Chief Economist for the New York City Comptroller–fatalities are one way to assess damage.

The Fatalities Metric

The latest report of fatalities as I write was issued at  1:16 am August 29 by CNN, with a total of 21 deaths in eight states–six in North Carolina, four in Virginia, four in Pennsylvania, three in New York State, and one each in four other states visited by Hurricane Irene.

The three fatalities in New York State were in (1) Spring Valley, Rockland Co., where a 50-year-old Good Samaritan electrocuted as he attempted to assist two people seeking to escape downed electrical wires, (2) New Scotland, Albany Co., where a woman was recovered after drowning in an overflowing creek, and (3) Bellport Bay, Suffolk Co., where a windsurfer drowned. The windsurfer death is assumed to be connected to a surge from Irene, but this may be revised.  New deaths may also be reported today as offices open and more information is shared.

Note that no fatalities have been reported in New York City, which has suffered from extensive flooding. The City Government took great precautions to evacuate people from low-lying areas and to discourage travel.

How does 21 deaths compare with loss of life in other hurricanes? The five deadliest Atlantic hurricanes since 1900 are (based on Black and Gibney, 2011, Table 3b, part 2, p. 11):

1. Galveston, TX, 1900, Category 4, 8,000-12,000 deaths.
2. Lake Okeechobee, FL, 1928, Category 4, 2,500-3,000 deaths.
3. Katrina, 2005, Category 3, 1,200 deaths.
4. Florida Keys, 1919, Category 4, 600 deaths (287 on land).
5. Long Island Express (Great New England), 1938, Category 3, 600 deaths (256 on land).

The Economic Damage Metric

Of course, the deadliest hurricanes are not always the most expensive to sustain and repair. Pielke et al. (R. A. Pielke, Jr., J. Gratz, C.W. Landsea, D. Collins, M. Saunders, and R. Musulin, 2008: "Normalized Hurricane Damages in the U.S.: 1900-2005." Natural Hazards Review, 9, 29-42, cited in Blake and Gibney, 2011) adjust historical data for inflation to 2010, wealth per capita and population. The ten costliest Atlantic hurricanes are listed below with their estimated damage. Note that earlier estimates are generally based on physical damage only, whereas later economic impact numbers include impacts such as business-interruption costs.

The economic impact on New York City of business interruption is great, but fortunately Hurricane Irene arrived in NYC on a weekend, when the impact is less serious than on a weekday. A major factor in business interruption is the cancellation of a reported 9,000 flights at NYC area airports as well as suspension of rail and bus services in the region.

Here is the list of the ten costliest hurricanes, in $billions of 2010 dollars:
1. Great Miami, 1926        164.8
2. Katrina, 2005                 113.4
3. Galveston, 1900             104.3
4. Galveston, 1915               71.4
5. Andrew, 1992                  60.5
6. L.I. Express, 1938            41.1
7. SW Florida, 1944             40.6
8. Lake Okeechobee, 1928   35.3
9. Ike, 2008                          29.5
10. Donna, 1960                   28.2

Of the five hurricanes with the greatest loss of life, four are on this list. The one that is missing is the Category 5 Florida Keys hurricane of 1919.

Equecat is estimating insurance claims of $1.5-3 billion. Kinetic Analysis Corp., a consulting firm in Silver Spring, MD that was estimating insurance losses at $14 billion several days ago, has cut its insurance losses estimate by more than 80 percent, to $2.6 billion, on losses from the storm of $7 billion. If business-interruption costs are added to physical losses, this number might be on the low side.

But compared with the fatalities and losses for the ten hurricanes with the largest damages, Hurricane Irene has not turned out to be one of the big ones, something to be thankful for.